A real-time monitoring tool for Apache Kafka that displays consumer lag and event rates in a clean, top-like interface.
kafkatop provides a simple, yet powerful, way to quickly view the health of your Kafka consumers and topics. It helps you identify bottlenecks and diagnose issues with consumer lag in real-time, directly from your terminal.
 |
|---|
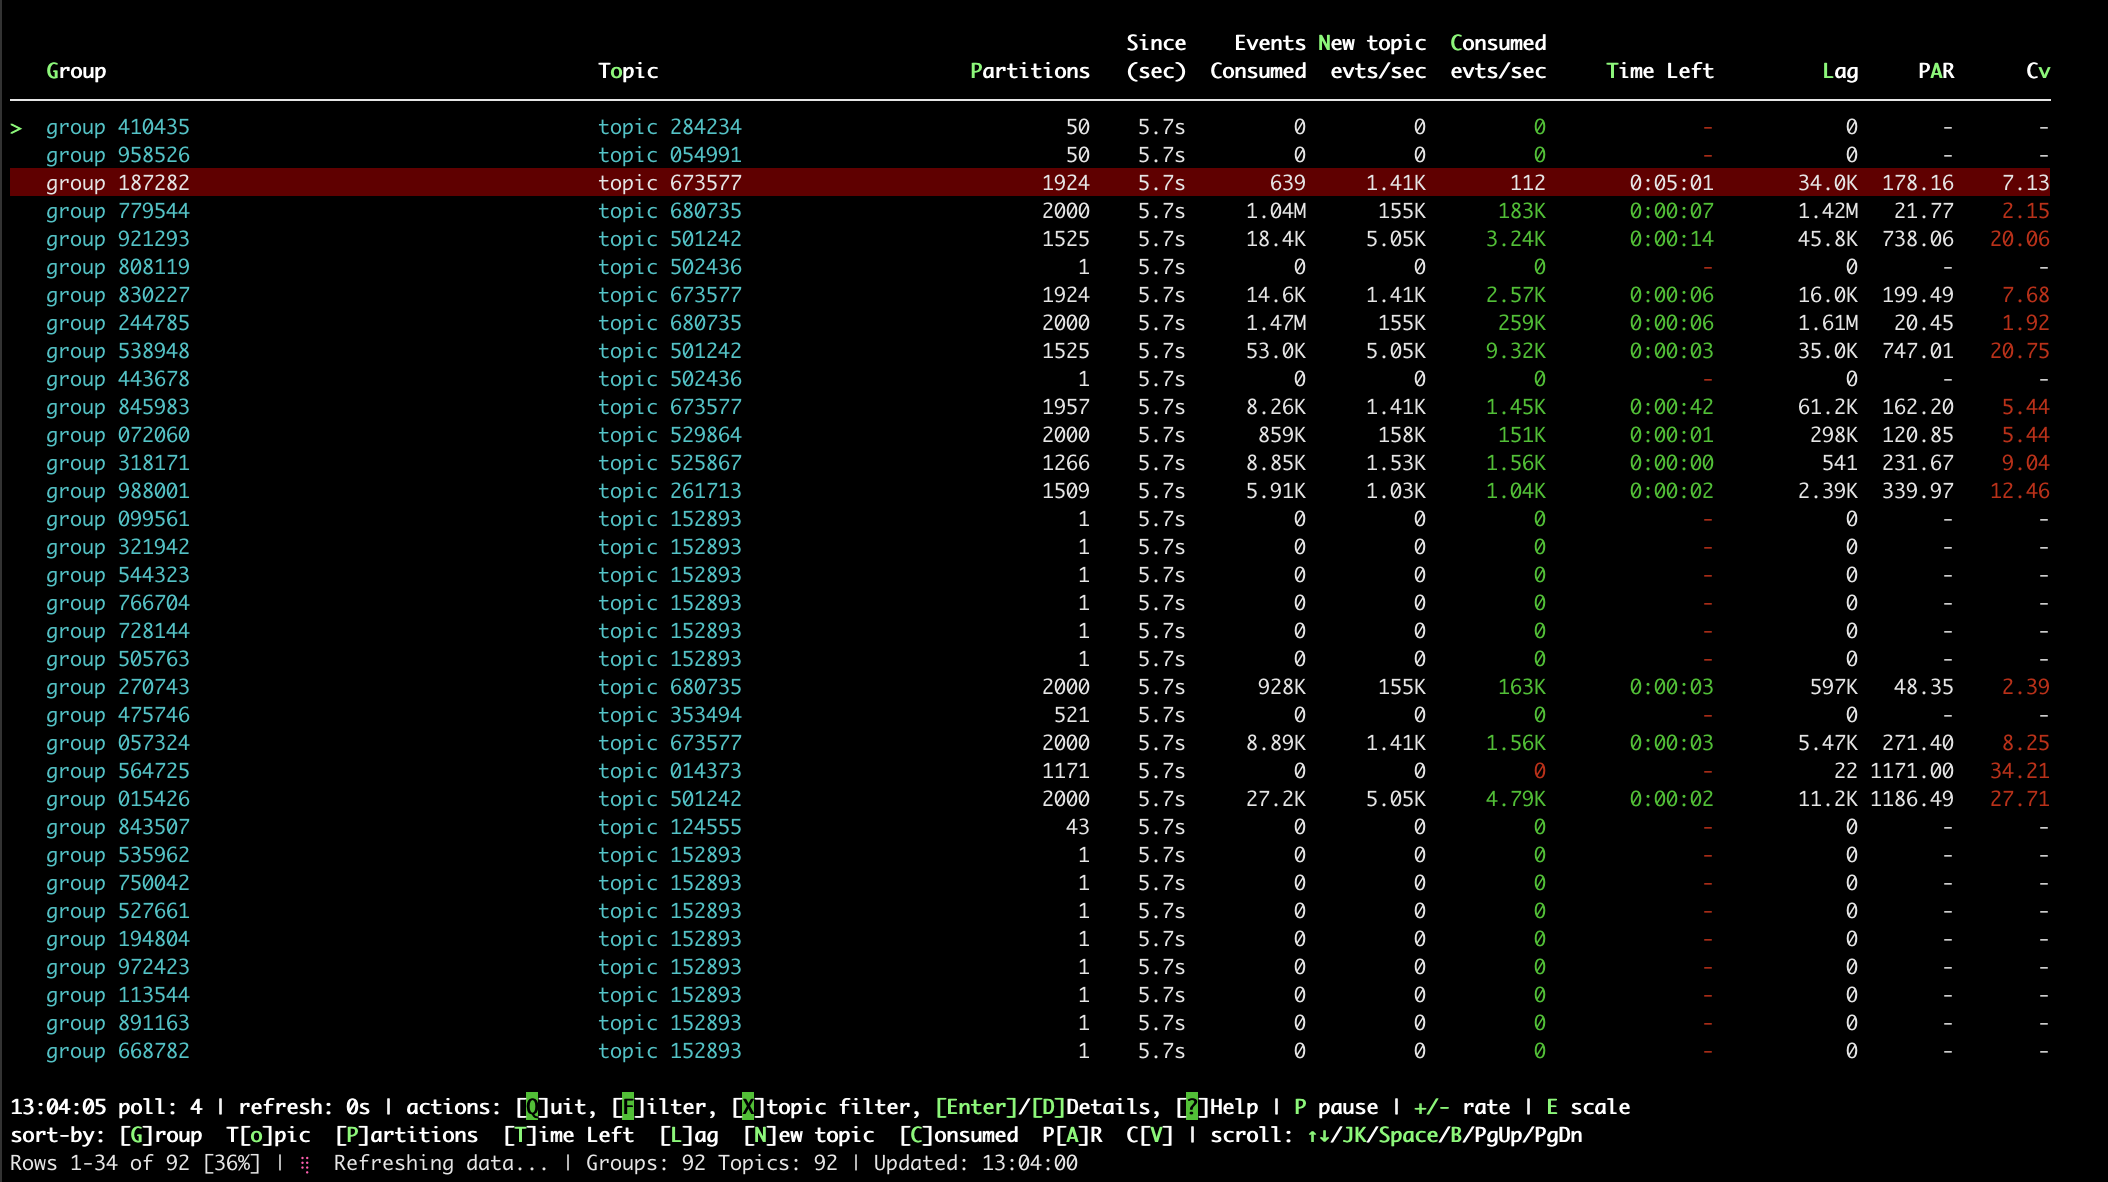
| Anonymized topics/groups. Highlighted row indicates consumption rate is much lower than arival rate of new events. PAR of 178 means the most busy partition is 178x more loaded than the mean, and Cv of 7 indicates an overall bad imbalance for all partitions. |
All version 1.x releases were python-based and distributed as a PEX binary. But as they relied on confluent-kafka which in turn depended on librdkafka it became hard to maintain it for older EOL OS (like CentOS7) where this library is no longer maintained upstream.
The new Go rewrite has feature-parity and several additional features; it will be the one receiving updates from now on. The binaries are static, and it utilizes franz-kafka under the hood which has no CGO dependencies, so it should be compatible with older libc systems.
- Real-time Monitoring: Keep an eye on event consumption and production rates across your Kafka broker.
- Consumer Lag & ETA: Instantly see the lag for each consumer group and topic, with an estimated time to catch up.
- Interactive TUI: Rich terminal UI with keyboard shortcuts for sorting, filtering, and navigation (press
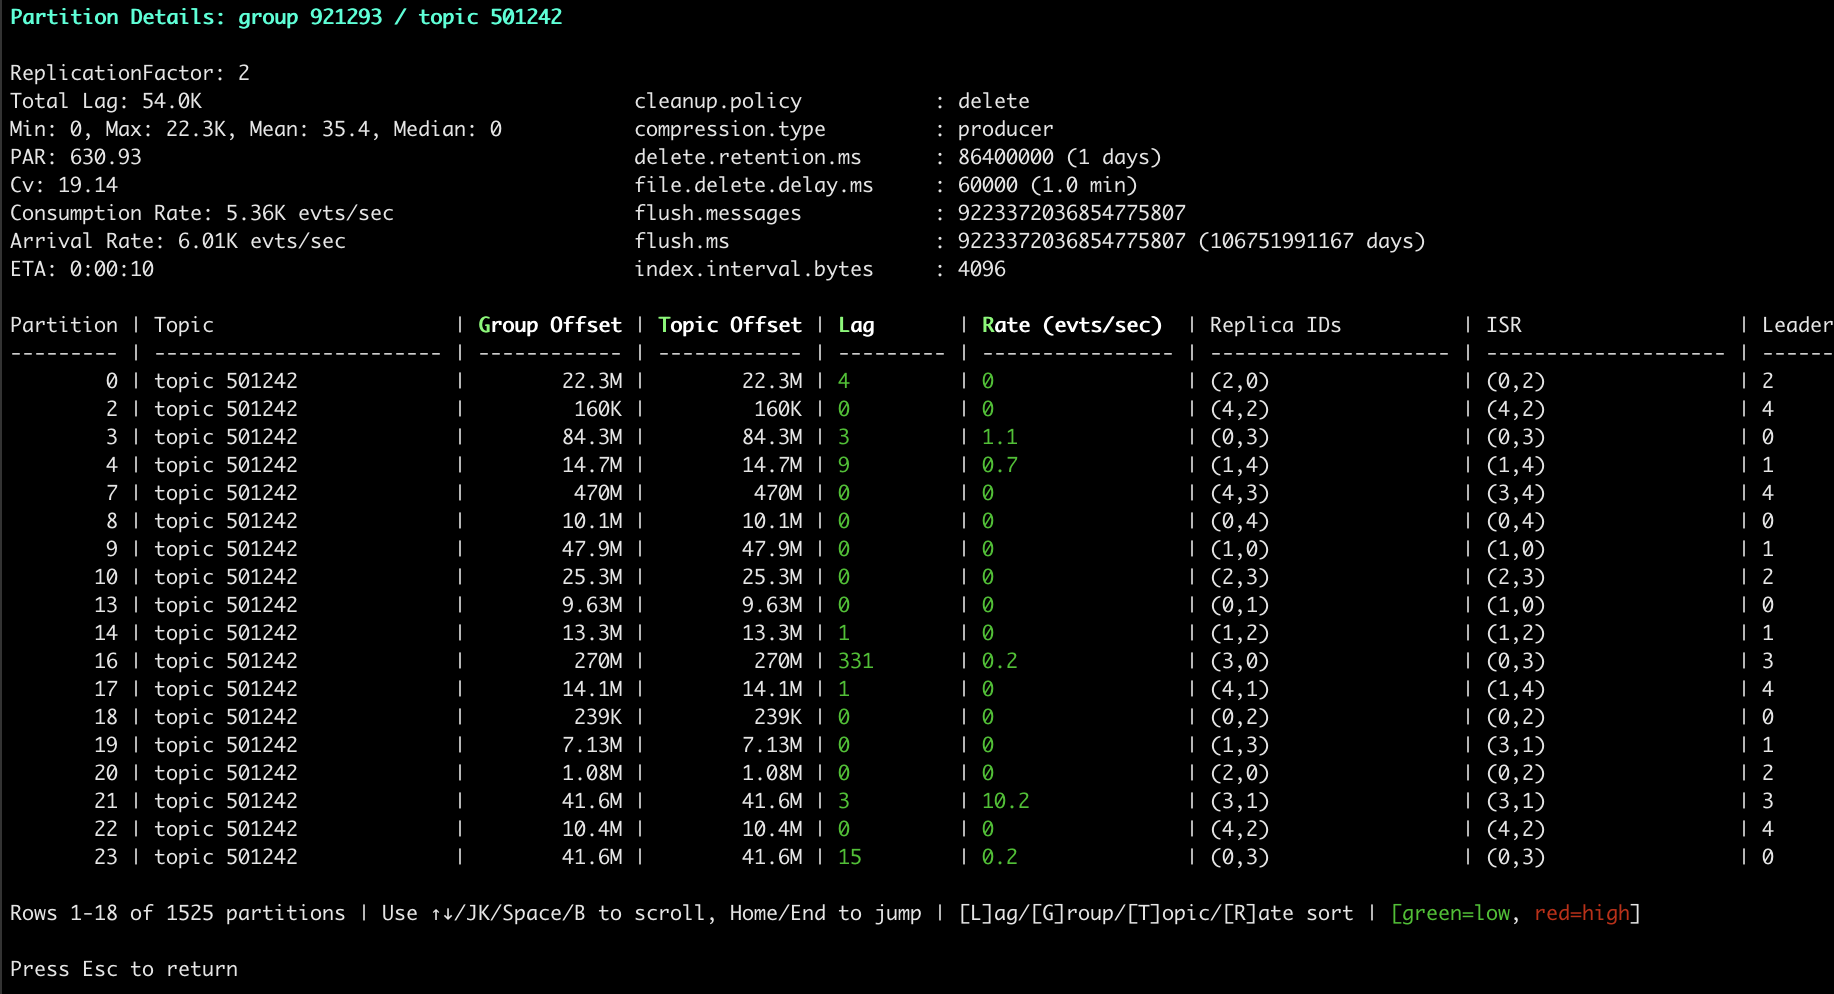
?for help). - Partition Details View: Drill down into partition-level details including offsets, lag, rates, replicas, ISR, and leaders.
- Partition Health Metrics:
- PAR (Peak-to-Average Ratio): Identifies hotspots - how much harder the busiest partition works vs. average
- Cv (Coefficient of Variation): Measures overall topic skew - how uniformly load is distributed
- Flexible Filtering: Easily filter by topic or consumer group name, and focus on problematic groups with a dedicated flag.
- JSON Output: Export the current status as a JSON object, for integrating with batch-collecting monitoring and alerting systems.
- Anonymization Mode: Anonymize topic and group names when sharing your screen or logs.
- Metadata Reporting: Export an overview of consumer and topic metadata (topics, partitions, ISR, leaders) in JSON.
- Performance Optimized: Parallel API calls, configurable concurrency, and detailed timing/profiling options.
Download the static binary from the releases page.
To get started, simply run kafkatop specifying the address of a Kafka broker if needed:
kafkatop # specify broker: -kafka-broker <broker-ip:broker-port>
Monitor a specific consumer group:
kafkatop --kafka-broker 10.227.1.110 --group-filter-pattern '.*group_name.*'Monitor Kafka running in Kubernetes, from the Kubernetes node:
# Port-forward the pod's port locally in another terminal, or in the background:
timeout 1200 kubectl port-forward kafka-0 9092:9092 &

# Run kafkatop on the node
kafkatop
View partition details:
In the interactive TUI, navigate to a row and press Enter or D to view detailed partition information including:
- Per-partition lag, offsets, and consumption rates
- Replica IDs, ISR (In-Sync Replicas), and Leader information
- Topic configuration (retention, segment size, etc.)
- Topic metadata (Replication Factor, Topic ID)
Export data for monitoring systems:
# JSON summary with all metrics
kafkatop --summary-json > kafka-status.json

# Health status check
kafkatop --status

# Topic metadata only (fast, no lag calculation)
kafkatop --topicinfo-parts
Usage of ./kafkatop:
-all
Show all groups (including those with no members)
-anonymize
Anonymize topic and group names
-debug
Enable debug output
-dns-map string
Custom DNS mappings: hostname1=ip1,hostname2=ip2 (e.g., broker-1.svc.cluster.local=10.227.1.111)
-eta-method string
ETA calculation method: 'simple' (consumption rate only) or 'net-rate' (accounts for incoming rate) (default "net-rate")
-group-exclude-pattern string
Exclude groups matching regex
-group-filter-pattern string
Filter groups by regex
-kafka-broker string
Broker address (host:port) (default "localhost:9092")
-max-concurrent int
Max concurrent API calls for lag calculation (0 or 1 = sequential, >1 = parallel) (default 10)
-only-issues
Show only groups with high lag/issues
-poll-iterations int
Refresh count before exiting (-1 for infinite) (default 15)
-poll-period int
Poll interval (sec) for rate calculations (default 5)
-status
Report health as JSON and exit
-summary
Display consumer groups, states, topics, partitions, and lags summary
-summary-json
Display consumer groups, states, topics, partitions, and lags summary in JSON and exit
-text
Disable rich text and color
-timing
Show timing/profiling information for lag calculation and exit
-topicinfo
Show topic metadata only (fast)
-topicinfo-parts
Show topic and partition metadata
-use-initial-broker-only
Use only initial broker address, ignore advertised addresses (useful for port forwarding to single-node Kafka; multi-node clusters may have limited functionality)
-version
Show version and exit
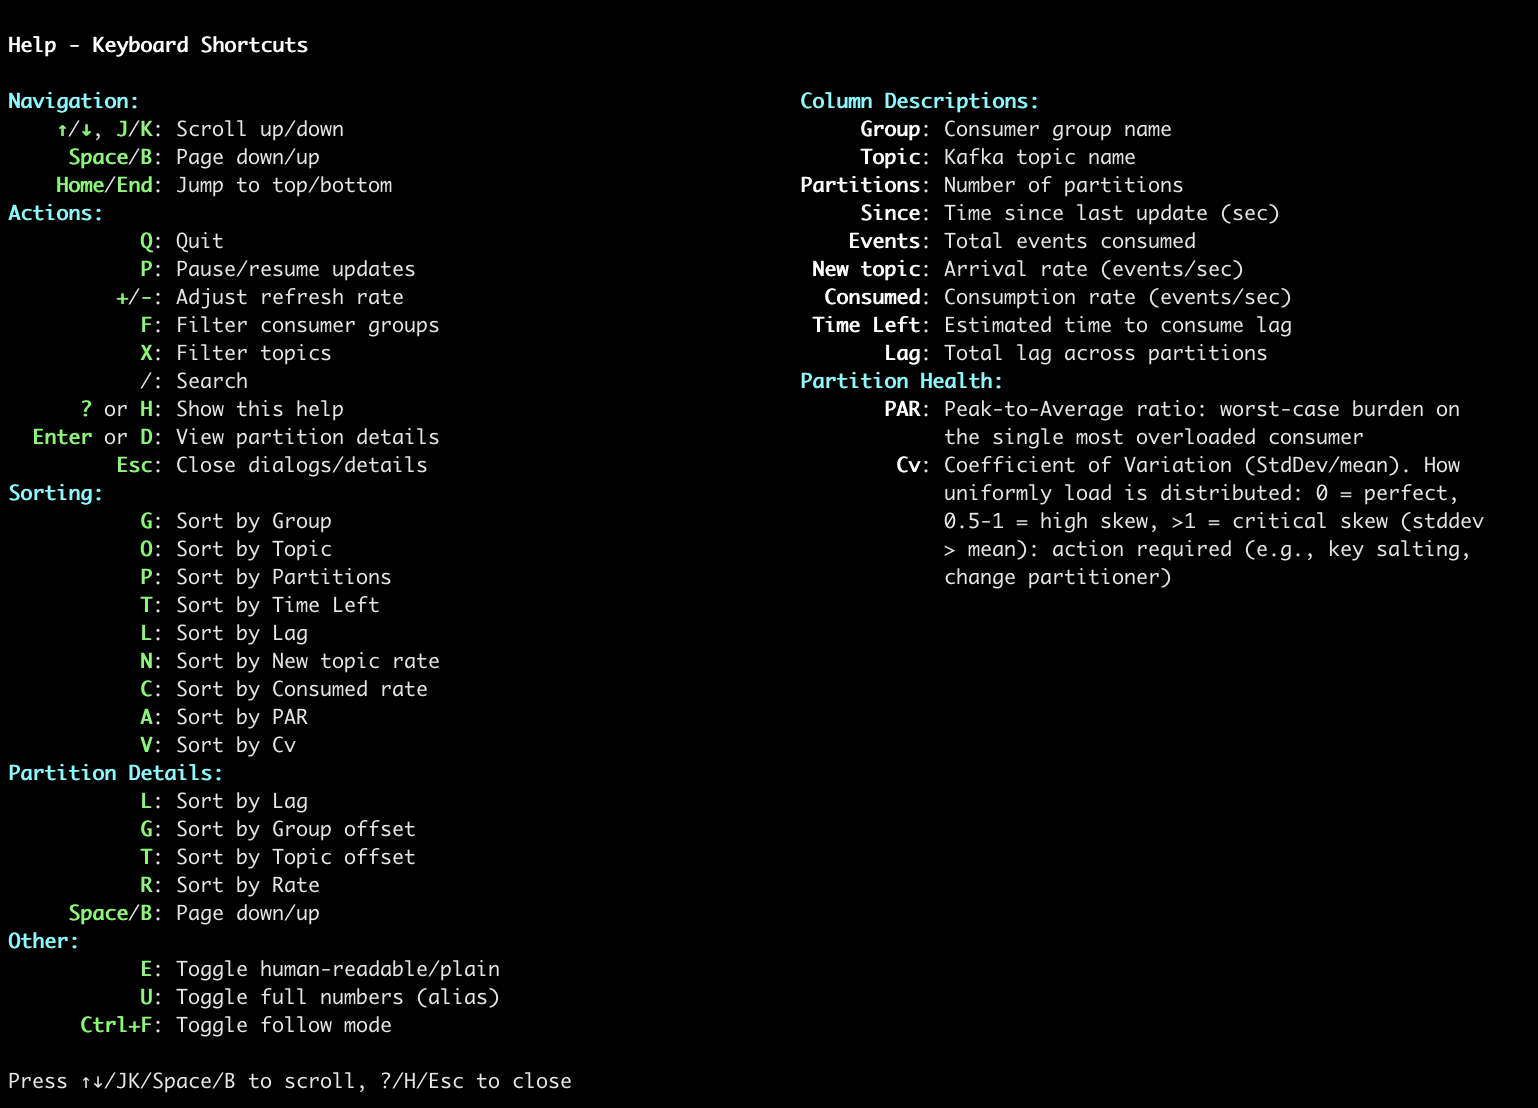
When running in interactive mode (default), use these keyboard shortcuts:
↑/↓orJ/K: Move up/downSpace/B: Page down/upHome/End: Jump to top/bottom/: Search for group/topic namesn/N: Next/previous search match
EnterorD: View partition details for selected rowF: Filter by consumer group (regex)X: Filter by topic name (regex)P: Pause/resume updates+/-: Increase/decrease refresh rateE: Toggle between human-readable and plain numbers?: Show help screen
G: Sort by GroupT/o: Sort by TopicP: Sort by PartitionsT: Sort by Time Left (ETA)L: Sort by LagN: Sort by New topic rateC: Sort by Consumed rateA: Sort by PAR (Peak-to-Average Ratio)V: Sort by Cv (Coefficient of Variation)
Press the same key again to reverse sort order.
Rows are highlighted with a red background when they have issues. The highlighting is based on ETA (Time Left) calculations:
- ETA >= 2 minutes (120 seconds), OR
- No consumption AND (arrival rate > 1.0 OR lag > 1000)
The ETA calculation method (--eta-method) determines how ETA is calculated, which affects which rows meet the highlighting threshold.
- ETA < 1 minute (
ETA0-59 seconds): Green ETA color, no highlight - ETA < 2 minutes (
ETA60-119 seconds): Yellow ETA color, no highlight
- ETA 2-10 minutes (
ETA120-599 seconds): Yellow ETA color highlighted - ETA 10m-2h (
ETA600-7199 seconds): Magenta ETA color, highlighted - ETA > 2h (
ETA>= 7200 seconds): Red ETA color, highlighted - No consumption (
ETA== -1): Red ETA color, highlighted (only ifNew Events/sec > 1.0ORlag > 1000)
The ETA calculation method affects which rows get highlighted:
- Uses only consumption rate:
ETA = lag / consumption_rate - Ignores incoming rate
- Original v1 behavior
- Accounts for both consumption and arrival rates:
ETA = lag / (consumption_rate - arrival_rate) - More accurate when data is arriving faster than being consumed
- If arrival > consumption, ETA shows as "-" (infinite/negative)
These affect cell colors but DO NOT trigger row highlighting:
- Rate color red: No consumption with lag (
lag > 0ANDconsumption_rate == 0) - Rate color red: Arrival rate > 5x consumption rate
- Rate color yellow: Arrival rate > 2x consumption rate
- Dark green background: Search matches (when searching with
/) - Dark blue background: Selected row (when navigating search results)
The following metrics are used by kafkatop to assess how uniformly events are distributed across a Kafka topic's partitions. Non-uniformity (skew) is a critical issue that leads to performance bottlenecks, overloaded consumers, and inefficient resource usage.
All calculations are based on the measured events per second per partition.
The Coefficient of Variation is the primary measure of overall topic health and the quality of your partitioning strategy. It is a unitless ratio that measures the relative spread of all partition loads.
-
$\sigma$ (Standard Deviation): Measures the absolute spread of all partition loads from the mean. -
$\mu$ (Mean): The average events/second across all partitions.
The
|
|
Health Status | Implication |
|---|---|---|
| Excellent / Healthy | Near-perfect uniformity. The partitioning key works well. | |
| Acceptable / Warning | Manageable non-uniformity. Variation is noticeable but usually operational. | |
| High Skew / Warning | The spread is significant. Inefficient resource usage and potential consumer issues. | |
| Critical Skew / Failure | Severe imbalance. The typical partition load is more than 100% away from the average. Consider a different partitioning key. |
The Peak-to-Average Ratio is the most important metric for capacity planning and immediate alerting. It measures the load on the single busiest partition compared to the ideal average. It only considers the 'worse case' partition, and does not provide overall topic health.
-
$\text{Load}_{\max}$ : The events/second of the single busiest (hottest) partition. -
$\mu$ (Mean): The average events/second across all partitions.
The PAR tells you "How much harder is my single busiest consumer working compared to the ideal average?"
| PAR Value | Implication | Consumer Status |
|---|---|---|
| Perfectly Balanced. | Ideal state. | |
| 10% Overloaded. | Safe margin, minor efficiency loss. | |
| 50% Overloaded. | A clear bottleneck. The consumer handling this partition may become lagged or unstable. | |
| 100% (2x) Overloaded. | Severe hotspot. Indicates a critical failure in the partition key selection. Immediate resolution is mandatory. |
| Scenario |
|
PAR (Hotspot Severity) | Diagnosis and Action |
|---|---|---|---|
| Ideal | Low ( |
Low ( |
Healthy topic. |
| Localized Hotspot | Low ( |
High ( |
Overall distribution is good, but one rare key is extremely hot. Focus on fixing that specific key. |
| Widespread Skew | High ( |
Medium ( |
Skew is pervasive, meaning many keys are causing small imbalances. The partitioning function is generally poor and needs re-evaluation. |
|
|---|
| Anonymized topics/groups. Highlighted row indicates consumption rate is much lower than arival rate of new events. PAR of 178 means the most busy partition is 178x more loaded than the mean, and Cv of 7 indicates an overall bad imbalance for all partitions. |
 |
|---|
| Topic details with partition rates and hottness. Cell colors indicate speed.* |
 |
|---|
| Help system. |
A machine-parseable JSON can be produced as well:
kafkatop --kafka-broker 1.2.3.4 --group-filter-pattern 'GroupName1' --summary-jsonResults in:
  "consumer-group-123": {
    "state": "STABLE",
    "topics": {
      "topic-123": {
        "configs": {
          "cleanup.policy": "delete",
          "compression.type": "producer",
          "delete.retention.ms": "86400000",
          "file.delete.delay.ms": "60000",
          "flush.messages": "9223372036854775807",
          "flush.ms": "9223372036854775807",
          "index.interval.bytes": "4096",
          "max.compaction.lag.ms": "9223372036854775807",
          "max.message.bytes": "1048588",
          "message.downconversion.enable": "true",
          "message.format.version": "3.0-IV1",
          "message.timestamp.difference.max.ms": "9223372036854775807",
          "message.timestamp.type": "CreateTime",
          "min.cleanable.dirty.ratio": "0.5",
          "min.compaction.lag.ms": "0",
          "min.insync.replicas": "1",
          "preallocate": "false",
          "retention.bytes": "-1",
          "retention.ms": "1209600000",
          "segment.bytes": "1073741824",
          "segment.index.bytes": "10485760",
          "segment.jitter.ms": "0",
          "segment.ms": "172800000",
          "unclean.leader.election.enable": "false"
        },
        "cv": 0,
        "lag_max": 0,
        "lag_min": 0,
        "par": 0,
        "partitions": 1
      }
    }
  },
The JSON output includes:
- Partition counts, lag statistics (min, max)
- Health metrics: PAR (Peak-to-Average Ratio) and Cv (Coefficient of Variation)
- Topic configuration values (when available)
Requirements: Go 1.21+
# Clone the repository
git clone https://github.com/sivann/kafkatop.git
cd kafkatop

# Build for your current platform
make go-build

# Or build for specific platforms
GOOS=linux GOARCH=amd64 make go-build    # Linux
GOOS=darwin GOARCH=amd64 make go-build   # macOS Intel
GOOS=darwin GOARCH=arm64 make go-build   # macOS Apple Silicon
GOOS=windows GOARCH=amd64 make go-build  # Windows
The resulting binary is fully static with no dependencies and will work on older systems like CentOS 7.
Check the README-PYTHON.md for documentation on the python implementation.
This project is licensed under the terms of the MIT license.